OctFlux CFD
Independent CFD development

Adaptive flow,
resolved where
it matters.

OctFlux CFD explores a finite-volume solver built around block-structured octree adaptive mesh refinement: focused resolution for evolving flow features, guided by verification from the start.

Octree AMR Block-structured spatial adaptivity
Finite volume Conservative flow formulation
Verification-led Benchmarks guide development
The approach

Make resolution a decision, not a default.

The project focuses on the foundations that make adaptive simulation credible: hierarchy, conservative coupling, and transparent validation.

01 / HIERARCHY

Structured blocks

A quadtree in 2D and octree in 3D organize fixed-size Cartesian blocks into a hierarchy that is practical to refine, traverse, and visualize.

02 / CONSERVATION

Interfaces matter

Adaptive grids are only useful when transitions are treated carefully. The focus is consistent transfer and conservation across coarse-to-fine regions.

03 / EVIDENCE

Measure the basics

Known flows, mesh sensitivity, and observable physical quantities set a clear bar for each milestone.

Validation roadmap

Small cases, useful evidence.

The initial benchmark suite is designed to make progress measurable from the start.

CYLINDER WAKE

Flow past a cylinder

Use an unsteady wake to examine separation, force trends, and adaptive resolution around a moving flow feature.

Compare: wake structure and nondimensional shedding frequency.
CANONICAL FLOWS

Transport & shock cases

Simple manufactured and canonical problems help test accuracy, stability, and adaptation logic before complexity grows.

Compare: conservation, order trends, and feature capture.
02 / Validation record
AMR evidence

One benchmark, one question, one record.

Read each case in the same order: a comparison establishes the reference, an animation shows where the hierarchy moves, and a compact readout states the numerical evidence. The sequence starts with the lid-driven cavity and then moves to wakes, interfaces, and stress tests.

Case records
Open to inspect

Each record uses the same interaction. Open a case to load the full, uncropped simulation GIF beside the setup and comparison basis. This keeps the page readable while preserving the full animation when you want to inspect it.

01 /Inspect the AMR evolutionOpen animation
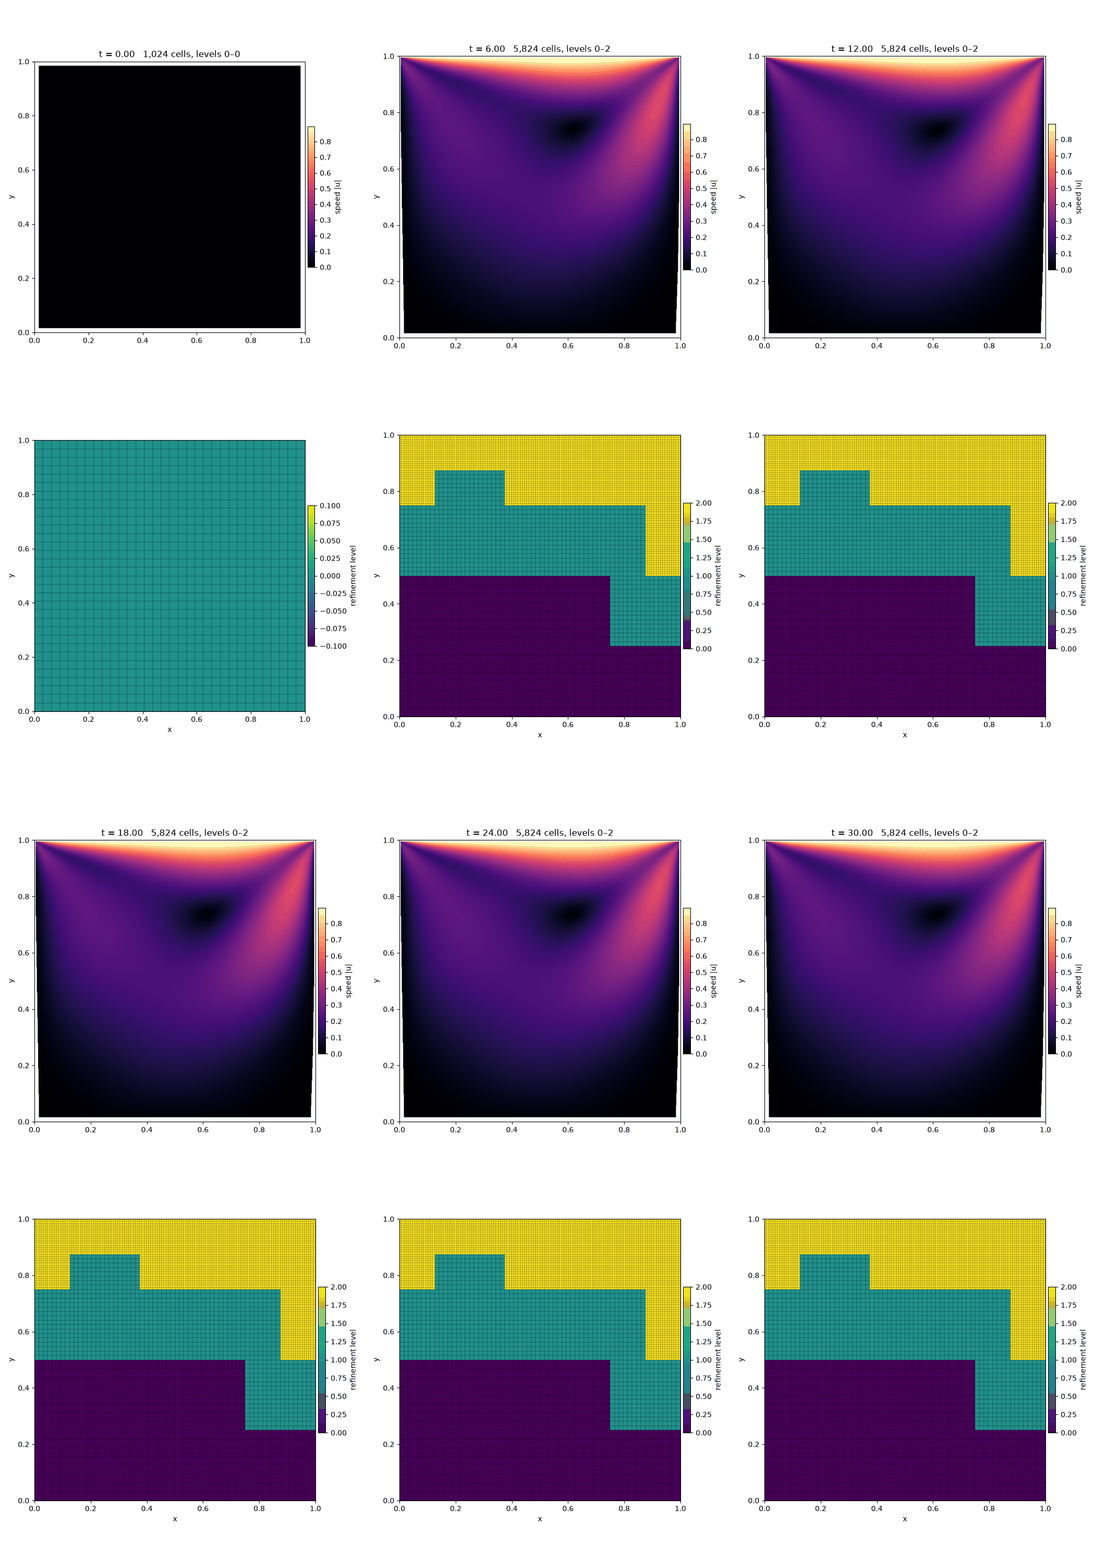
Full animated lid-driven cavity flow and adaptive refinement levels at Reynolds number 100

Opening the case record loads the full simulation.

CAVITY / RE = 100 / GRADIENT AMR

Start with a reference flow.

The cavity is the first validation record because its centreline profiles give a direct numerical comparison before interpreting adaptive behaviour.
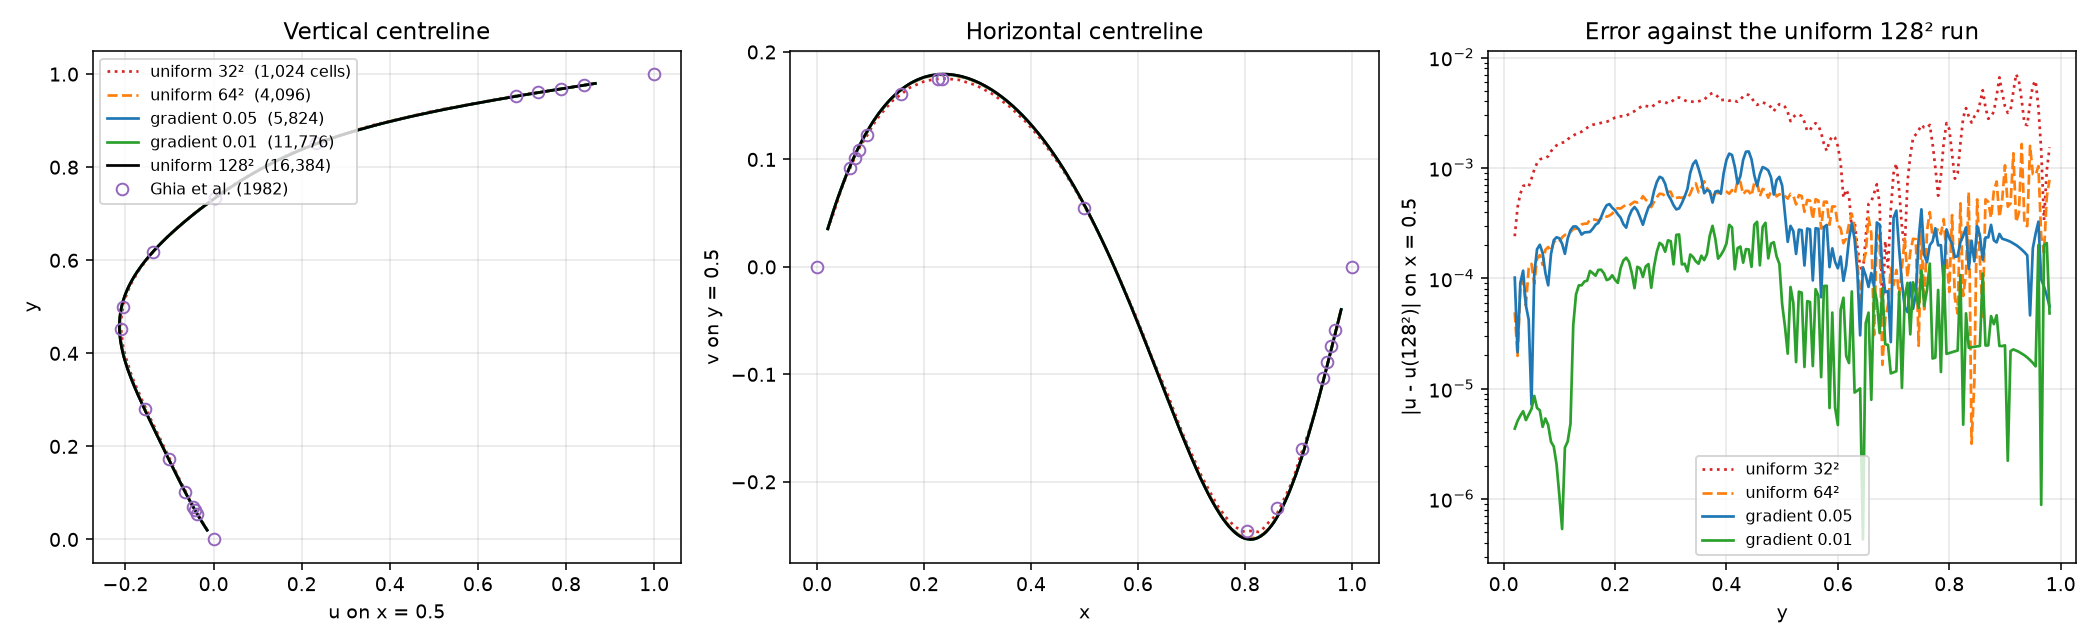
  • REFERENCEUniform 128² grid and Ghia et al. (1982) centreline data.
  • AMR SIZE5,824 active cells, versus 16,384 uniform 128² cells.
  • ERRORRMS u = 4.7 × 10⁻⁴; RMS v = 2.7 × 10⁻⁴ relative to the uniform 128² field.
Lid-driven cavity centreline velocity profiles and error against a uniform 128 squared reference grid
AMR profiles compared with uniform grids and Ghia et al. reference data.
5,824AMR active cells
16,384uniform 128² cells
4.7 × 10⁻⁴RMS u error vs. 128²
2.7 × 10⁻⁴RMS v error vs. 128²
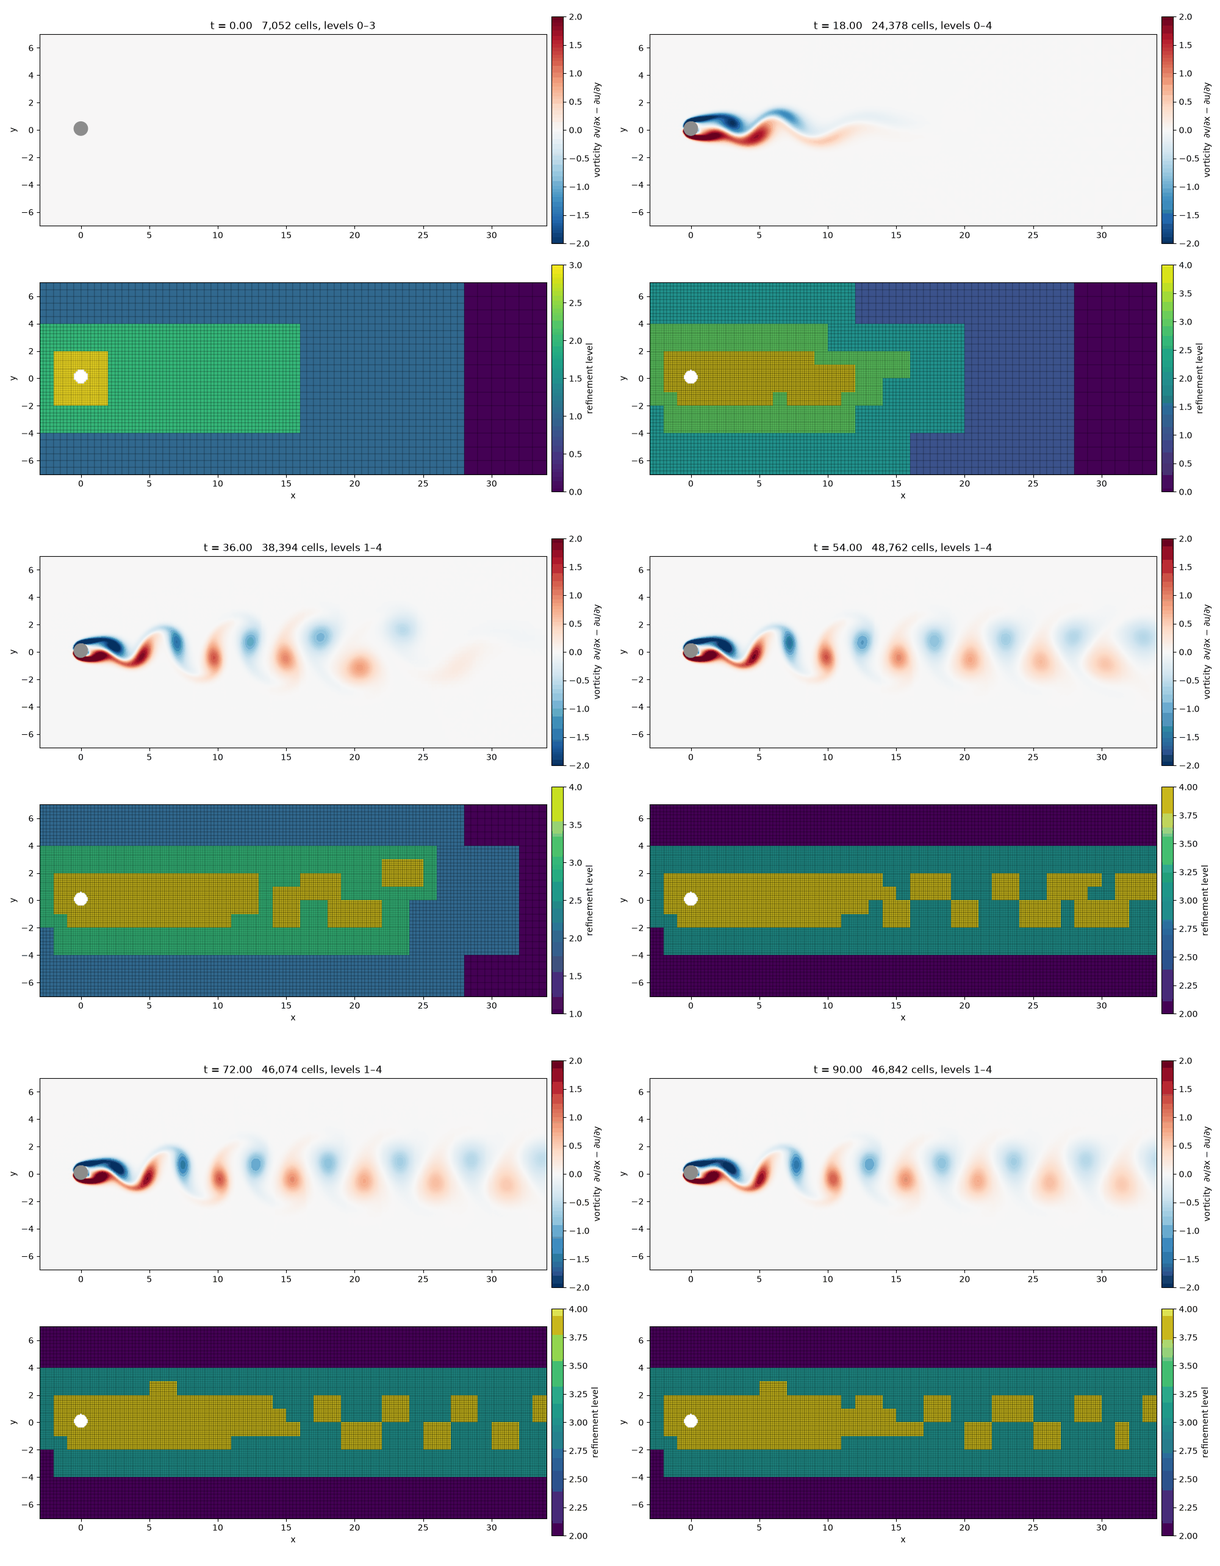
02 /Cylinder wake — static and dynamic AMROpen animation
Full animated AMR refinement levels following a vortex street behind a cylinder at Reynolds number 100

Opening the case record loads the full simulation.

CYLINDER / RE = 40 AND 100

Refinement follows the wake.

The steady Re = 40 case establishes body and near-wake resolution. The Re = 100 record then shows dynamic tagging following the moving vortex street.

  • STATIC CASERe = 40: 15,600 leaf cells, with D/16 finest spacing.
  • DYNAMIC CASERe = 100: velocity-magnitude tagging every 20 steps, up to D/32.
  • ACTIVE CELLS21,184–32,128 leaf cells; uniform D/32 equivalent: 2,621,440 cells.
  • RUN250 time units, 35,630 steps, and 1,350 regrids.
03 /Rising bubble — interface-tracking animationOpen animation
Full animated rising bubble with AMR refinement following the two-phase interface

Opening the case record loads the full simulation.

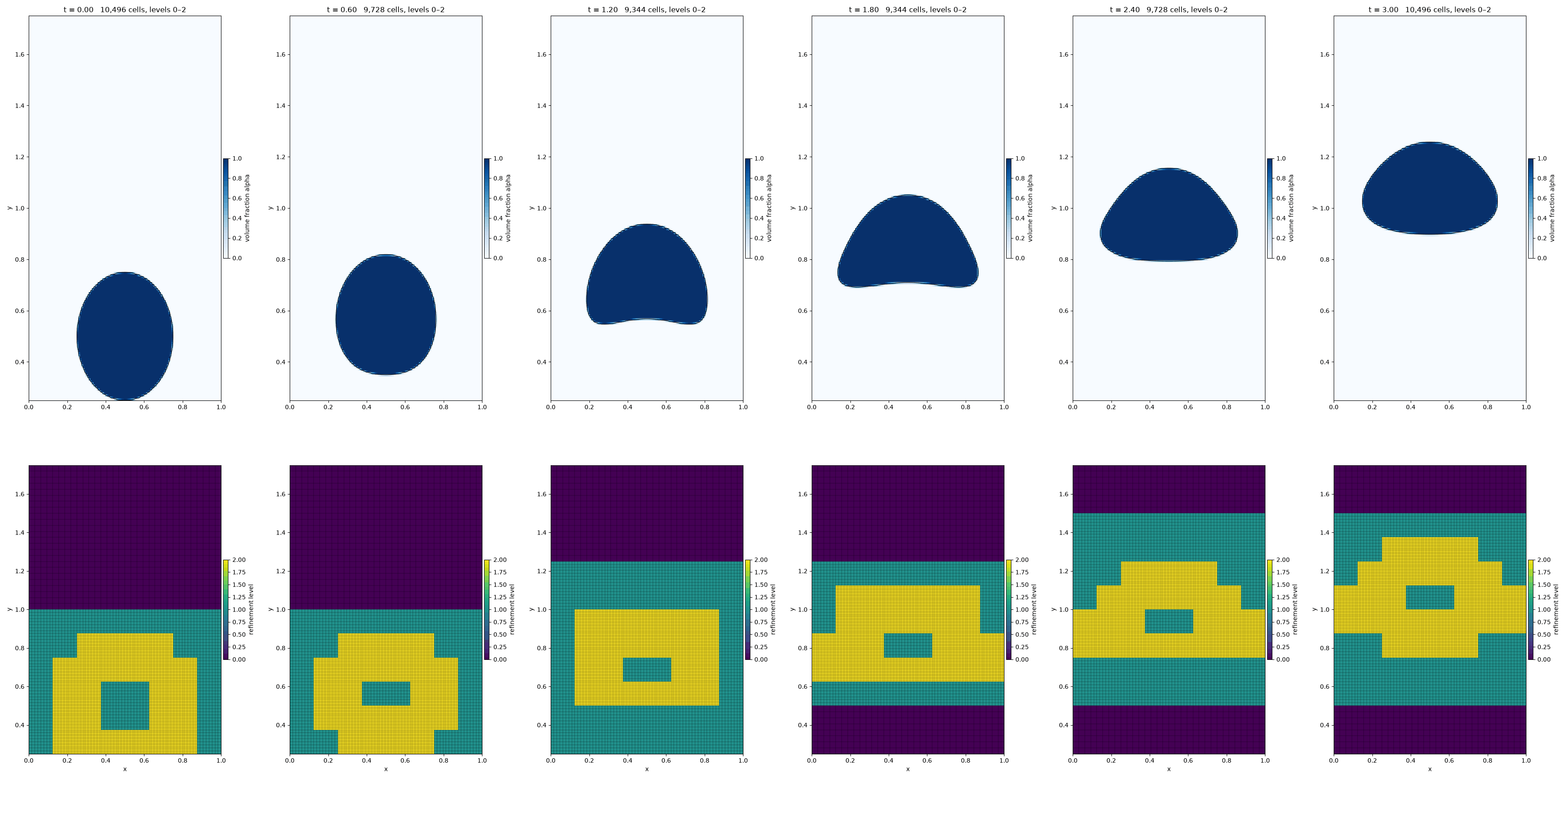
HYSING CASE 1 / MOVING INTERFACE

Keep the interface resolved.

The GIF shows the hierarchy moving with the bubble rather than retaining fine resolution across the entire liquid column.
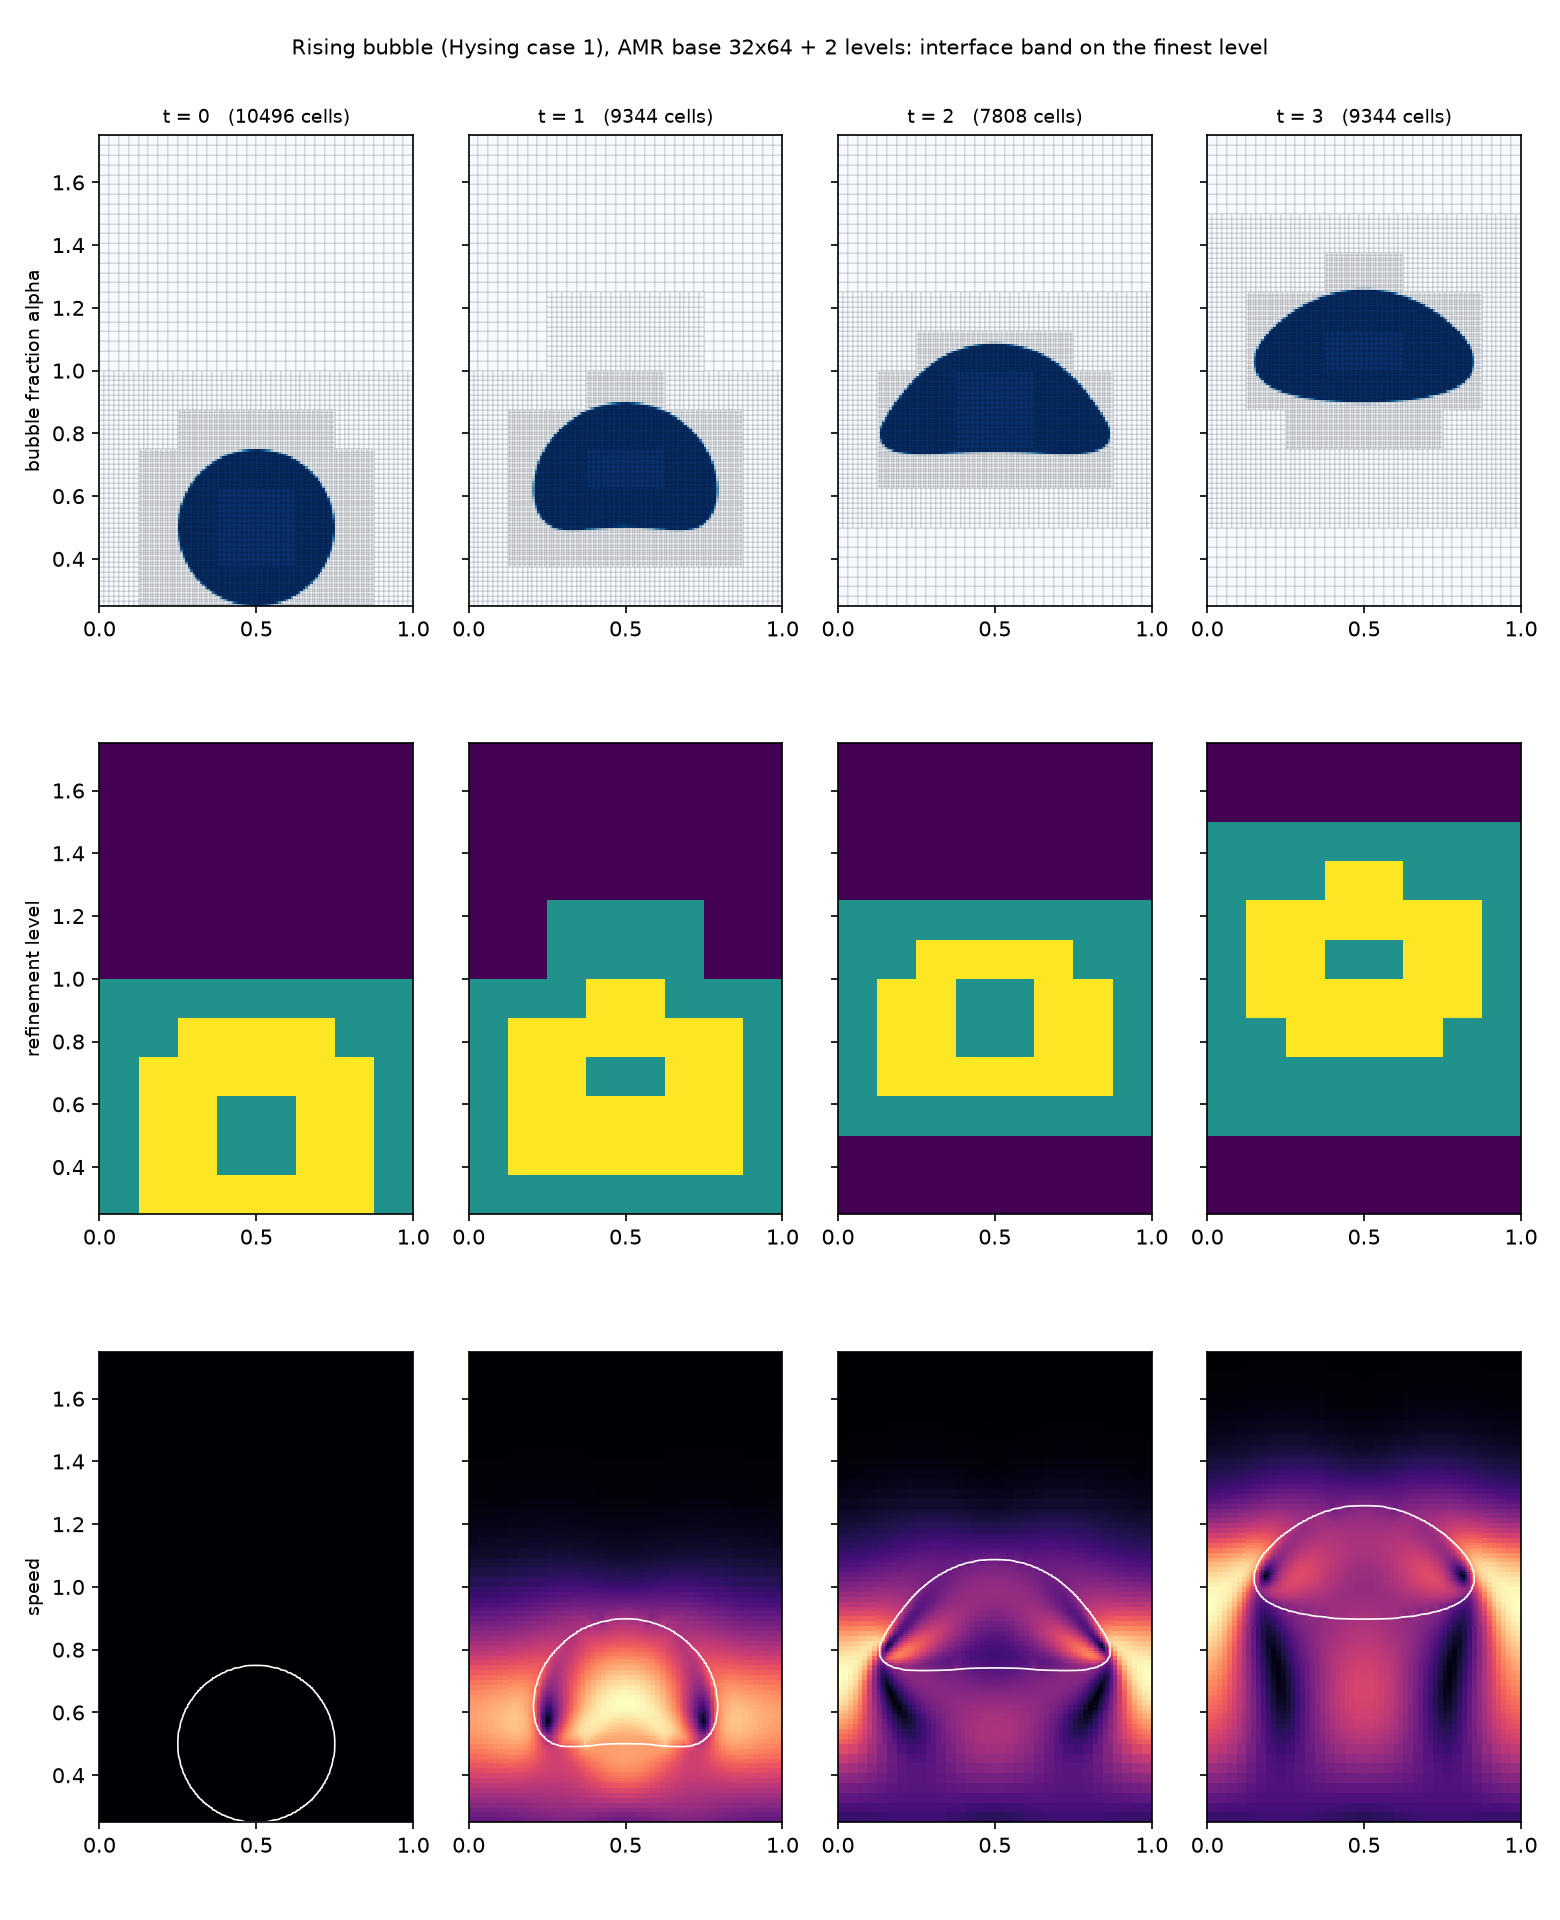
  • COMPARISONRise velocity and centre-of-mass histories against uniform-grid runs.
  • AMR SIZEAbout 8,000–10,000 active leaf cells during the evolution.
  • FINE REFERENCE32,768 cells on the uniform fine grid.
Rising bubble snapshots showing bubble shape, AMR refinement levels, and speed field over time
COMPARISON / HYSING CASE 1

Snapshots make the interface-following refinement visible; the chart compares velocity and centre of mass with uniform-grid runs.
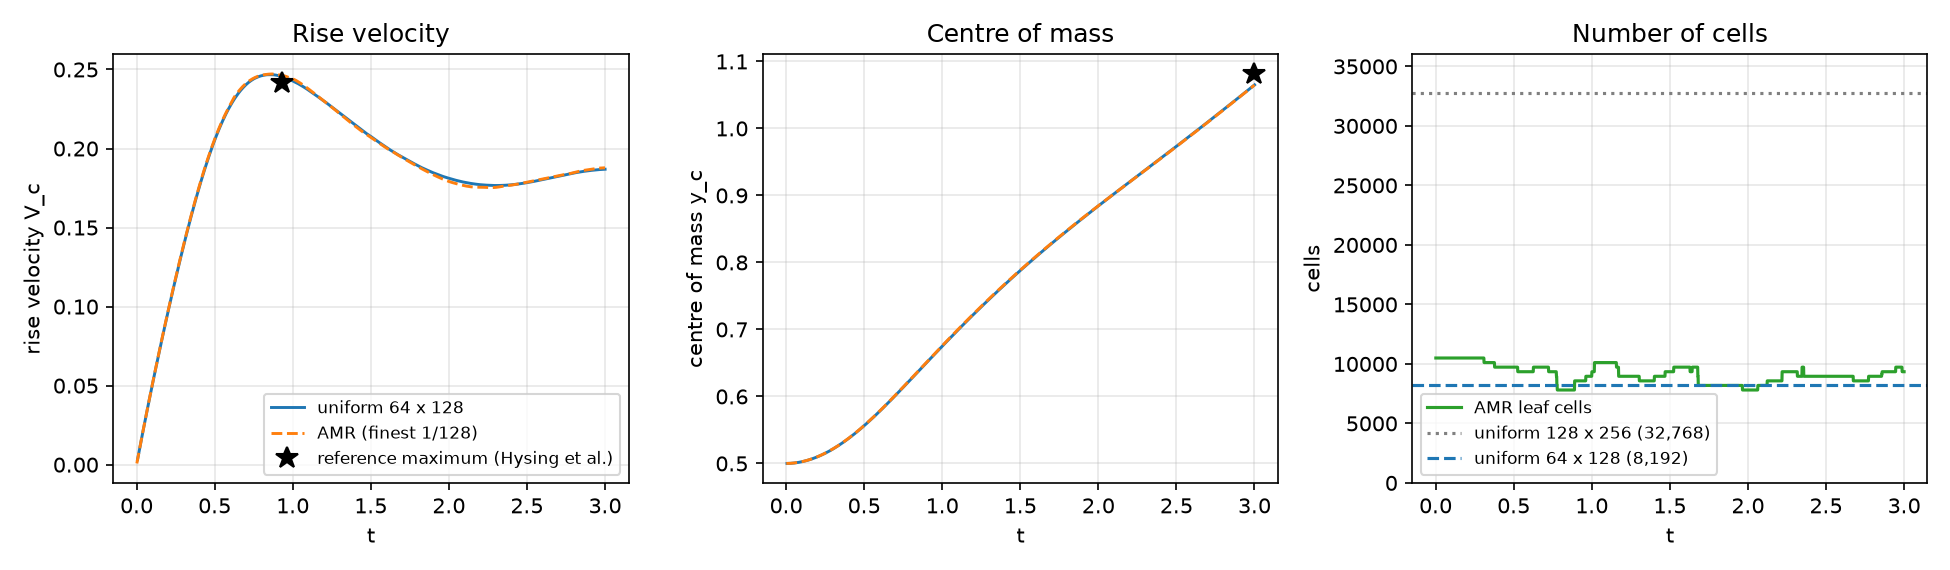
Rising bubble velocity, centre of mass, and AMR leaf-cell count compared with uniform grids
8k–10kAMR leaf cells during the evolution
32,768cells in the uniform fine reference
CASES 04–06 / STRESS AND TRANSPORT TESTS

Additional evidence, same representation.

These cases use the same expandable full-animation record: a drop impact for robustness, Rayleigh–Taylor growth against theory, and vortex reversal for interface transport.

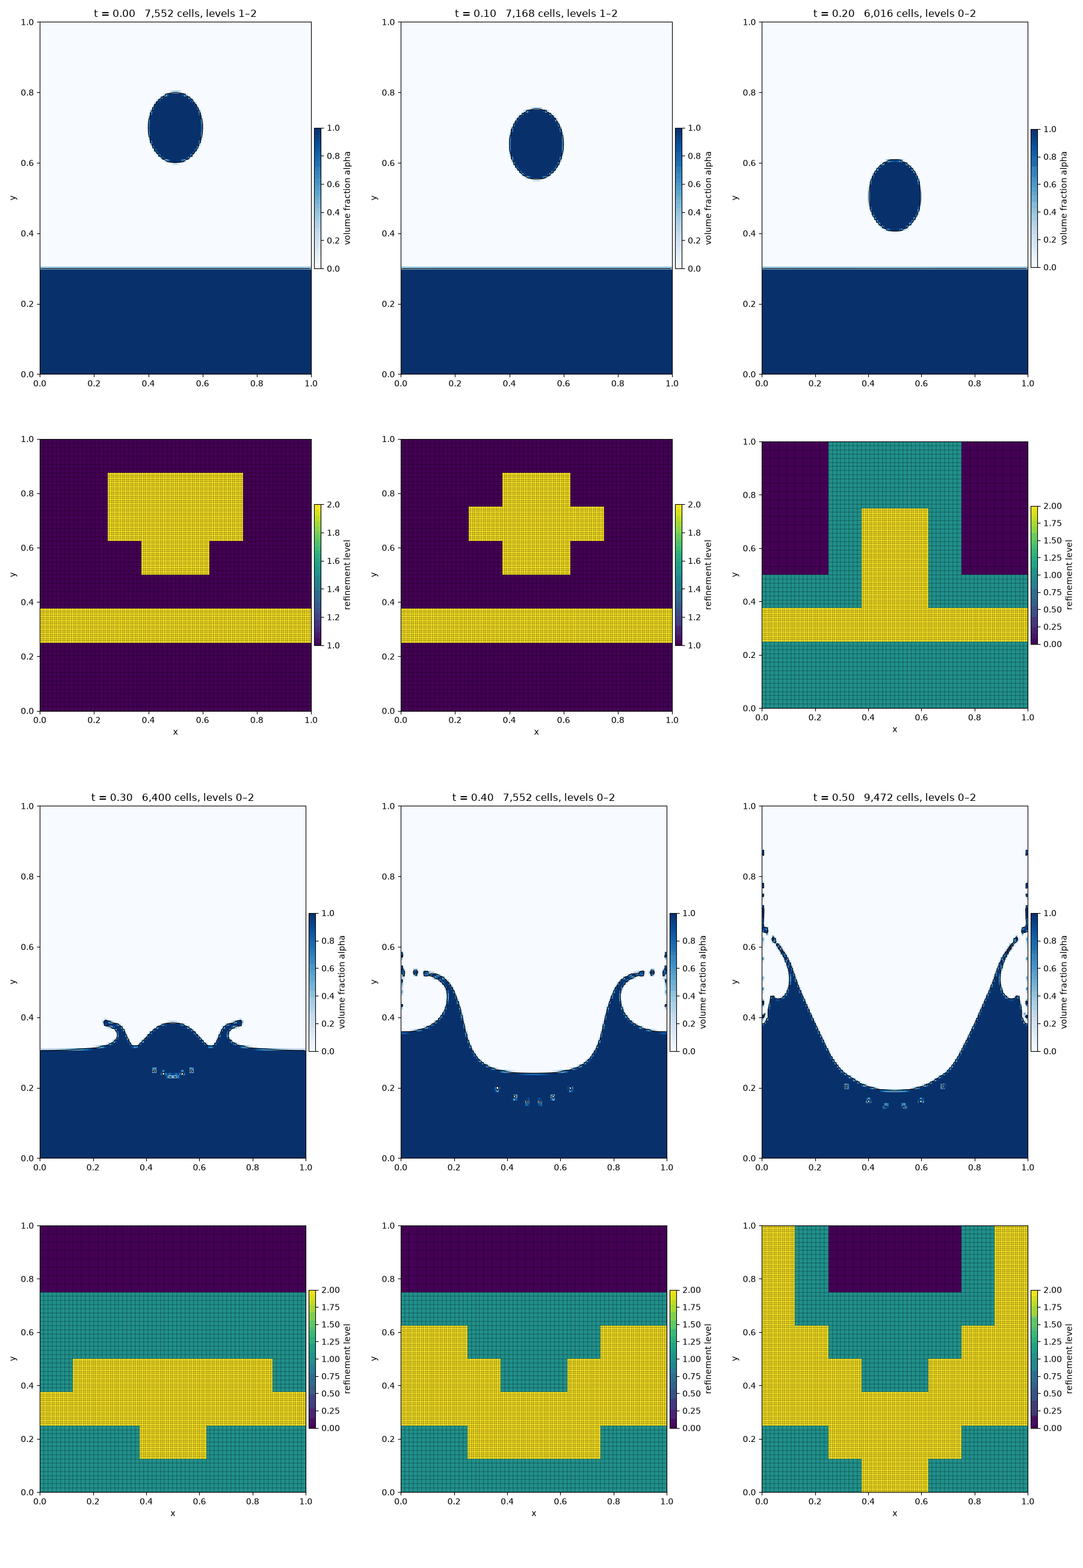
04 /Droplet impact — crater and jetsOpen animation
Full animated two-dimensional water-drop impact into a pool with adaptive mesh refinement

Opening the case record loads the full simulation.

DROP INTO POOL / 1000:1

Robustness through impact.

A falling water drop impacts a pool, forming a crater and jets. The record monitors conservative transport as the free surface changes rapidly.

  • AMR SIZE7,370 mean leaf cells; 9,472 peak, versus 16,384 uniform-equivalent cells.
  • CONSERVATIONPhase-volume drift: 2.0 × 10⁻¹⁴.
  • CHECKFinal water centre of mass agrees with the conservative uniform run within 0.01.
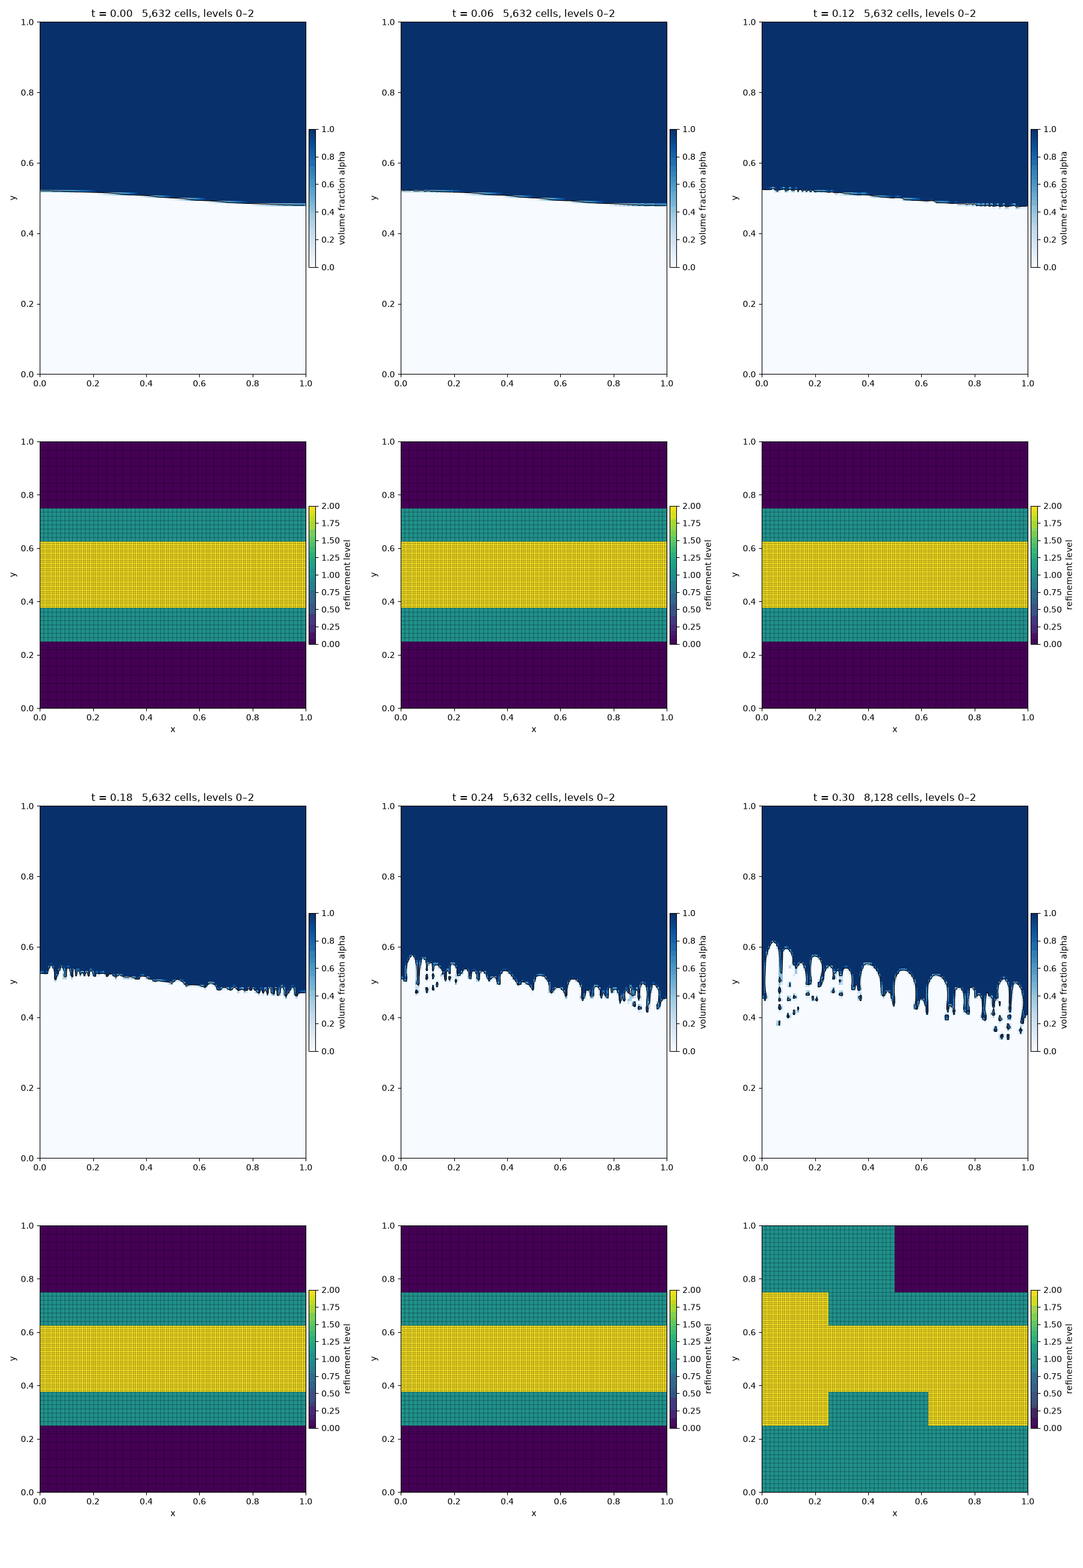
05 /Rayleigh–Taylor instability — growth against theoryOpen animation
Full animated Rayleigh-Taylor instability at 1000 to 1 density ratio with adaptive mesh refinement

Opening the case record loads the full simulation.

RAYLEIGH–TAYLOR / 1000:1

Growth measured against theory.

A perturbed heavy-over-light interface develops under gravity while the AMR band follows the instability.

  • COMPARISONTwo-layer linear theory and a uniform 128² run.
  • RESULTAt t = 0.2, amplitude growth is within 2.9% of theory.
  • AMR SIZE6,147 mean leaf cells versus 16,384 uniform cells.
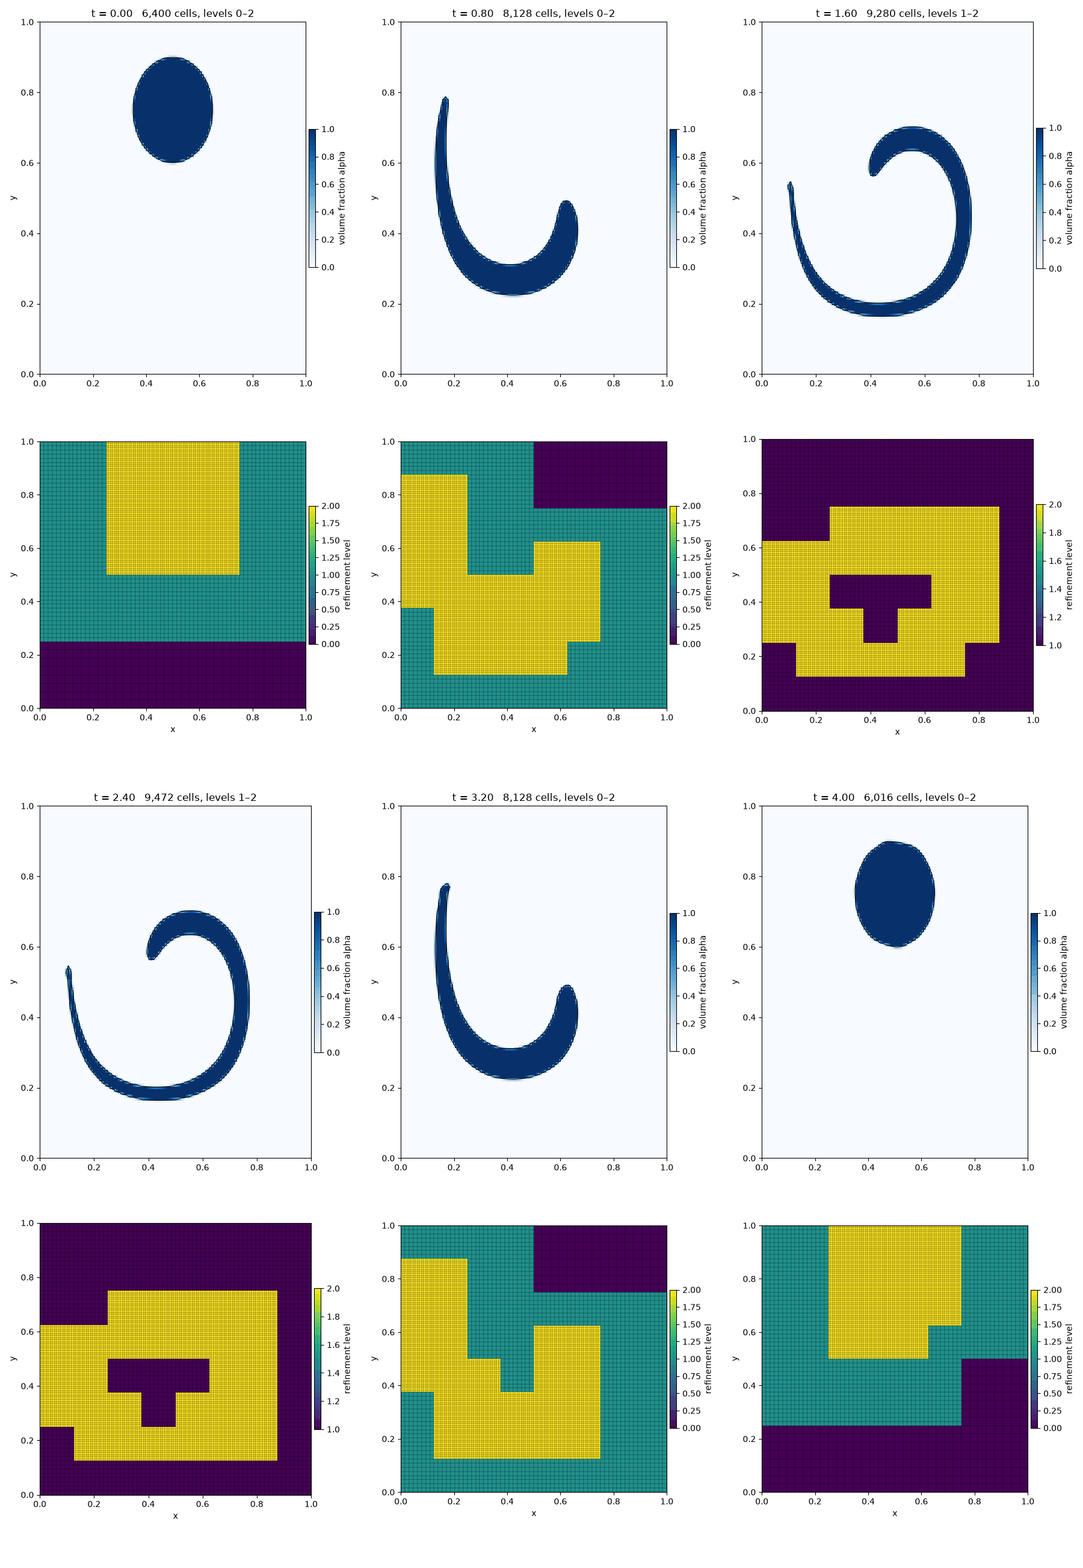
06 /2D vortex reversal — stretch, reverse, recoverOpen animation
Full animated two-dimensional vortex-reversal transport test with adaptive mesh refinement

Opening the case record loads the full simulation.

LEVEQUE VORTEX / T = 4

Test transport reversibility.

A disc stretches into a thin spiral and the velocity field reverses, making recovery of the initial shape a clear transport check.

  • COMPARISONMatches the uniform 128² reference at the final state.
  • RESULT1.03% relative L1 shape error and zero recorded mass drift.
  • AMR SIZE7,968 mean leaf cells versus 16,384 uniform cells.
Project status

Under active development.

OctFlux CFD is an independent technical project. Public updates will be added as reproducible benchmark material becomes available.